Grundlæggende statistik
| Institutionelle aktier (lange) | 38.564.495 - 68,11% (ex 13D/G) - change of 0,60MM shares 1,01% MRQ |
| Institutionel værdi (lang) | $ 310.843 USD ($1000) |
Institutionelt ejerskab og aktionærer
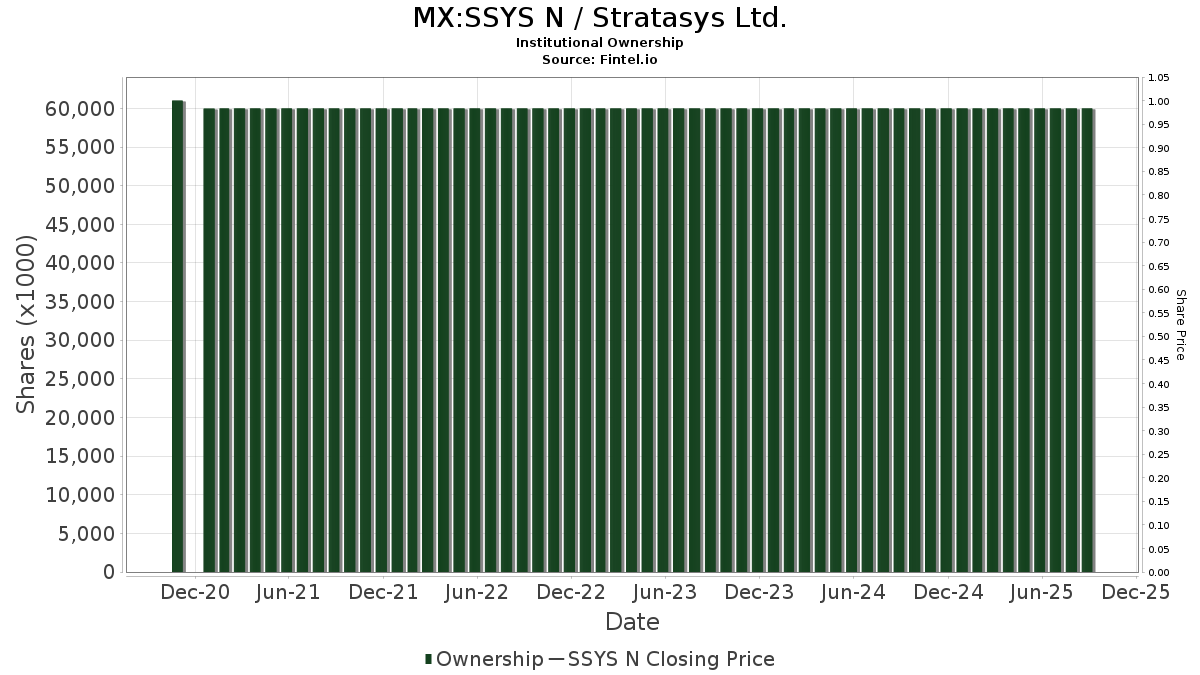
Stratasys Ltd. (MX:SSYS N) har 153 institutionelle ejere og aktionærer, der har indsendt 13D/G- eller 13F-formularer til Securities Exchange Commission (SEC). Disse institutioner har i alt 38,564,495 aktier. Største aktionærer omfatter Rubric Capital Management LP, Neuberger Berman Group LLC, Phoenix Holdings Ltd., Migdal Insurance & Financial Holdings Ltd., Invenomic Capital Management LP, Exchange Traded Concepts, Llc, State Street Corp, Capital World Investors, RPG Investment Advisory, LLC, and Legal & General Group Plc .
Stratasys Ltd. (BMV:SSYS N) institutionel ejerskabsstruktur viser aktuelle positioner i virksomheden efter institutioner og fonde, samt seneste ændringer i positionsstørrelse. Større aktionærer kan omfatte individuelle investorer, investeringsforeninger, hedgefonde eller institutioner. Skema 13D angiver, at investoren besidder (eller besidder) mere end 5 % af virksomheden og har til hensigt (eller har til hensigt at) aktivt at forfølge en ændring i forretningsstrategi. Skema 13G indikerer en passiv investering på over 5%.
Fondens stemningsscore
Fund Sentiment Score (fka Ownership Accumulation Score) finder de aktier, der bliver mest købt af fonde. Det er resultatet af en sofistikeret, multi-faktor kvantitativ model, der identificerer virksomheder med de højeste niveauer af institutionel akkumulering. Scoringsmodellen bruger en kombination af den samlede stigning i oplyste ejere, ændringerne i porteføljeallokeringer i disse ejere og andre målinger. Tallet går fra 0 til 100, hvor højere tal indikerer et højere niveau af akkumulering for sine jævnaldrende, og 50 er gennemsnittet.
Opdateringsfrekvens: Dagligt
Se Ownership Explorer, som giver en liste over højest rangerende virksomheder.
AI+ Ask Fintel’s AI assistant about Stratasys Ltd..
Select a question to share a public post with an AI-crafted answer.
Thinking of good questions…
13F og NPORT arkivering
Detaljer om 13F-arkivering er gratis. Detaljer om NP-ansøgninger kræver et premium-medlemskab. Grønne rækker angiver nye positioner. Røde rækker angiver lukkede positioner. Klik på linket ikon for at se den fulde transaktionshistorik.
Opgrader
for at låse premium-data op og eksportere til Excel ![]() .
.
| Fil dato | Kilde | Investor | Type | Gennemsnitlig pris (Øst) |
Aktier | Δ Aktier (%) |
Rapporteret Værdi ($1000) |
Δ Værdi (%) |
Port Alloc (%) |
|
|---|---|---|---|---|---|---|---|---|---|---|
| 2026-02-13 | 13F | Hurley Capital, LLC | 0 | -100,00 | 0 | |||||
| 2025-11-07 | 13F | HighTower Advisors, LLC | 0 | -100,00 | 0 | -100,00 | ||||
| 2025-11-14 | 13F | Wolverine Trading, Llc | 21.895 | 248 | ||||||
| 2026-02-11 | 13F | Primecap Management Co/ca/ | 0 | -100,00 | 0 | -100,00 | ||||
| 2026-02-10 | 13F | Hazlett, Burt & Watson, Inc. | 300 | 0,00 | 0 | |||||
| 2026-02-17 | 13F | Two Sigma Investments, Lp | 19.128 | -81,36 | 166 | -85,55 | ||||
| 2026-01-28 | 13F | Geneos Wealth Management Inc. | 151 | 0,00 | 1 | 0,00 | ||||
| 2026-02-05 | 13F | Allworth Financial LP | 1.552 | 170,38 | 13 | 116,67 | ||||
| 2026-02-10 | 13F | CIBC Asset Management Inc | 10.745 | 93 | ||||||
| 2026-02-13 | 13F | C M Bidwell & Associates Ltd | 40 | 0,00 | 0 | |||||
| 2025-11-14 | 13F | Manchester Capital Management LLC | 2.330 | 0,00 | 26 | 0,00 | ||||
| 2025-11-06 | 13F | Abich Financial Wealth Management LLC | 0 | -100,00 | 0 | |||||
| 2026-02-11 | 13F | ARK Investment Management LLC | 450.915 | 1,03 | 3.914 | -21,71 | ||||
| 2026-02-17 | 13F | D. E. Shaw & Co., Inc. | 94.529 | -45,06 | 821 | -57,42 | ||||
| 2026-01-21 | 13F | Sound Income Strategies, LLC | 57 | 0,00 | 1 | |||||
| 2026-02-17 | 13F | XTX Topco Ltd | 41.805 | 363 | ||||||
| 2026-02-13 | 13F | Wells Fargo & Company/mn | 2.350 | 0,00 | 20 | -23,08 | ||||
| 2026-04-21 | 13F | Financial Consulate, Inc | 400 | 0,00 | 3 | 0,00 | ||||
| 2026-02-12 | 13F | Wealthspire Advisors, LLC | 0 | -100,00 | 0 | |||||
| 2026-02-06 | 13F | Larson Financial Group LLC | 22 | -87,64 | 0 | -100,00 | ||||
| 2025-10-29 | 13F | Meitav Dash Investments Ltd | 0 | -100,00 | 0 | -100,00 | ||||
| 2026-02-17 | 13F | Oxford Asset Management Llp | 19.193 | 167 | ||||||
| 2026-02-17 | 13F | Symmetry Peak Management Llc | Call | 0 | -100,00 | 0 | ||||
| 2026-02-13 | 13F | Vontobel Holding Ltd. | 12.935 | 112 | ||||||
| 2026-02-17 | 13F | MIRAE ASSET GLOBAL ETFS HOLDINGS Ltd. | 225.952 | 10,39 | 1.970 | -14,91 | ||||
| 2026-02-13 | 13F | Quinn Opportunity Partners LLC | 11.144 | 0,00 | 97 | -22,58 | ||||
| 2026-02-17 | 13F | Advisor Group Holdings, Inc. | 14.095 | 35,11 | 122 | 7,96 | ||||
| 2026-02-17 | 13F | Prelude Capital Management, Llc | 34.037 | 0,00 | 295 | -22,57 | ||||
| 2026-02-03 | 13F | SBI Securities Co., Ltd. | 7.506 | -2,21 | 65 | -23,53 | ||||
| 2026-02-17 | 13F | Ameriprise Financial Inc | 92.681 | 7,35 | 804 | -16,77 | ||||
| 2026-02-04 | 13F | Atlantic Union Bankshares Corp | 200 | 2 | ||||||
| 2026-04-20 | 13F | State of Alaska, Department of Revenue | 4.042 | 0,00 | 0 | |||||
| 2026-02-13 | 13F | Quarry LP | 0 | -100,00 | 0 | -100,00 | ||||
| 2026-02-17 | 13F | Jones Financial Companies Lllp | 4.407 | 169,54 | 38 | 111,11 | ||||
| 2026-02-17 | 13F | Schonfeld Strategic Advisors LLC | 11.274 | 98 | ||||||
| 2026-02-09 | 13F | Huntington National Bank | 166 | 0,00 | 1 | 0,00 | ||||
| 2026-01-30 | 13F | Laurel Wealth Advisors LLC | 40 | 0 | ||||||
| 2026-02-13 | 13F | Pingora Partners LLC | 200 | 0,00 | 2 | -50,00 | ||||
| 2025-11-14 | 13F | Graham Capital Management, L.P. | 0 | -100,00 | 0 | |||||
| 2026-02-10 | 13F | Operose Advisors LLC | 138 | 0,00 | 1 | 0,00 | ||||
| 2025-10-31 | 13F | Barrett & Company, Inc. | 0 | -100,00 | 0 | |||||
| 2026-02-13 | 13F | Neuberger Berman Group LLC | 4.292.998 | -3,01 | 37.269 | -24,85 | ||||
| 2025-11-14 | 13F | Trexquant Investment LP | 0 | -100,00 | 0 | |||||
| 2026-02-06 | 13F | Global Retirement Partners, LLC | 2.967 | 26 | ||||||
| 2026-02-17 | 13F | Clearline Capital LP | 608.684 | -20,21 | 5.283 | -38,16 | ||||
| 2025-11-14 | 13F/A | Skopos Labs, Inc. | 0 | -100,00 | 0 | -100,00 | ||||
| 2026-02-13 | 13F | Arrowstreet Capital, Limited Partnership | 69.539 | -4,19 | 604 | -25,74 | ||||
| 2026-02-17 | 13F | Aquatic Capital Management LLC | 17.618 | 153 | ||||||
| 2026-04-17 | 13F | AdvisorNet Financial, Inc | 350 | 0,00 | 3 | -33,33 | ||||
| 2026-02-06 | 13F | GPS Wealth Strategies Group, LLC | 0 | -100,00 | 0 | |||||
| 2026-04-22 | 13F | Old Point Trust & Financial Services N A | 100 | 0,00 | 1 | |||||
| 2026-02-13 | 13F | Stifel Financial Corp | 26.597 | -14,71 | 231 | -34,10 | ||||
| 2026-02-17 | 13F | Northern Trust Corp | 34.170 | -0,40 | 297 | -22,92 | ||||
| 2026-01-28 | 13F | Migdal Insurance & Financial Holdings Ltd. | 2.130.983 | 0,00 | 18 | -21,74 | ||||
| 2026-02-13 | 13F | OMERS ADMINISTRATION Corp | 0 | -100,00 | 0 | |||||
| 2025-11-14 | 13F | Wolverine Trading, Llc | Call | 75.400 | 383,33 | 853 | 389,66 | |||
| 2025-11-14 | 13F | Wolverine Trading, Llc | Put | 23.200 | 28,89 | 262 | 30,35 | |||
| 2026-02-12 | 13F | Hrt Financial Lp | 0 | -100,00 | 0 | |||||
| 2026-02-12 | 13F | Counterpoint Mutual Funds LLC | 58.852 | 511 | ||||||
| 2025-10-29 | 13F | AMH Equity Ltd | 166.000 | 0,00 | 1.859 | -2,36 | ||||
| 2026-02-17 | 13F | Ancora Advisors, LLC | 37 | 0,00 | 0 | |||||
| 2026-02-17 | 13F | Keebeck Alpha, LP | 34.034 | 0,00 | 295 | -22,57 | ||||
| 2026-01-20 | 13F | Harbor Capital Advisors, Inc. | 22.294 | 9,38 | 0 | |||||
| 2026-02-11 | 13F | Franklin Resources Inc | 13.092 | -3,57 | 114 | -25,66 | ||||
| 2026-02-06 | 13F | Pnc Financial Services Group, Inc. | 607 | 0,00 | 5 | -16,67 | ||||
| 2026-02-05 | 13F | Phoenix Holdings Ltd. | 3.630.006 | 0,22 | 31.509 | -22,33 | ||||
| 2026-01-09 | 13F | Inspirion Wealth Advisors, Llc | 0 | -100,00 | 0 | |||||
| 2026-02-13 | 13F | Headlands Technologies LLC | 40.118 | 37,78 | 348 | 6,75 | ||||
| 2025-10-29 | 13F | AMH Equity Ltd | Call | 0 | -100,00 | 0 | -100,00 | |||
| 2026-02-11 | 13F | Group One Trading, L.p. | Put | 19.900 | -20,08 | 173 | -38,13 | |||
| 2026-02-11 | 13F | Group One Trading, L.p. | Call | 177.000 | -8,57 | 1.536 | -29,15 | |||
| 2026-02-13 | 13F | Morgan Stanley | 407.043 | 38,38 | 3.533 | 7,26 | ||||
| 2026-02-11 | 13F | Group One Trading, L.p. | 18.249 | -83,99 | 158 | -87,62 | ||||
| 2026-04-15 | 13F | Douglas Lane & Associates, LLC | 570.564 | -1,33 | 4.456 | -11,22 | ||||
| 2026-01-26 | 13F | Cwm, Llc | 249 | -34,30 | 0 | |||||
| 2025-11-06 | 13F | Ameritas Advisory Services, LLC | 0 | -100,00 | 0 | |||||
| 2025-11-04 | 13F | Flaharty Asset Management, LLC | 0 | -100,00 | 0 | |||||
| 2026-02-18 | 13F | GWM Advisors LLC | 405 | 0,00 | 4 | -25,00 | ||||
| 2026-02-06 | 13F | Nano Cap New Millennium Growth Fund L P | 112.500 | 976 | ||||||
| 2026-04-08 | 13F | NorthCrest Asset Manangement, LLC | 17.970 | 0,00 | 143 | -18,29 | ||||
| 2026-01-29 | 13F | Focused Wealth Management, Inc | Put | 0 | -100,00 | 0 | ||||
| 2026-02-13 | 13F | Rubric Capital Management LP | 7.340.026 | -5,93 | 63.711 | -27,10 | ||||
| 2026-02-14 | 13F | Rockefeller Capital Management L.P. | 59.875 | 4,51 | 520 | -19,03 | ||||
| 2026-02-10 | 13F | Monaco Asset Management SAM | 115.000 | 998 | ||||||
| 2026-02-17 | 13F | Public Employees Retirement System Of Ohio | 1.294 | -4,64 | 11 | -26,67 | ||||
| 2026-04-23 | 13F | CWM Advisors, LLC | 66.235 | 21,91 | 517 | 9,77 | ||||
| 2026-02-09 | 13F | Harbour Investments, Inc. | 1.101 | 0,00 | 10 | -25,00 | ||||
| 2026-02-10 | 13F | Connor, Clark & Lunn Investment Management Ltd. | 384.841 | 6,14 | 3.340 | -17,73 | ||||
| 2026-02-17 | 13F | Citadel Advisors Llc | 214.530 | -4,54 | 1.862 | -26,02 | ||||
| 2026-02-17 | 13F | Citadel Advisors Llc | Call | 29.300 | -62,24 | 254 | -70,77 | |||
| 2026-02-17 | 13F | Two Sigma Securities, Llc | 0 | -100,00 | 0 | |||||
| 2026-02-13 | 13F | Rafferty Asset Management, LLC | 0 | -100,00 | 0 | |||||
| 2026-02-17 | 13F | Citadel Advisors Llc | Put | 67.500 | 89,61 | 586 | 46,98 | |||
| 2026-02-12 | 13F | Titleist Asset Management, Llc | 24.700 | 214 | ||||||
| 2026-02-11 | 13F | Capital World Investors | 1.357.460 | 0,00 | 11.783 | -22,50 | ||||
| 2026-02-13 | 13F | Smartleaf Asset Management LLC | 100 | 1 | ||||||
| 2026-02-17 | 13F | Ulysses Management LLC | 0 | -100,00 | 0 | |||||
| 2026-02-05 | 13F | GABELLI & Co INVESTMENT ADVISERS, INC. | 118.834 | -10,01 | 1.031 | -30,29 | ||||
| 2026-02-11 | 13F | Janney Montgomery Scott LLC | 0 | -100,00 | 0 | |||||
| 2025-10-28 | 13F | Wolverine Asset Management Llc | 0 | -100,00 | 0 | |||||
| 2026-02-05 | 13F | Tejara Capital Ltd | 250.000 | 2.170 | ||||||
| 2026-02-23 | 13F | Virtu Financial LLC | 0 | -100,00 | 0 | |||||
| 2026-02-17 | 13F/A | RBF Capital, LLC | 100.000 | -13,04 | 868 | -32,61 | ||||
| 2026-02-13 | 13F | Barclays Plc | 46.039 | 55,37 | 400 | 20,54 | ||||
| 2026-01-20 | 13F | RPG Investment Advisory, LLC | 1.106.999 | -2,35 | 9.609 | -24,32 | ||||
| 2026-02-17 | 13F | Fmr Llc | 1 | 0,00 | 0 | |||||
| 2026-02-09 | 13F | Geode Capital Management, Llc | 46.121 | 18,35 | 400 | -8,26 | ||||
| 2026-02-13 | 13F | Caitong International Asset Management Co., Ltd | 588 | 5 | ||||||
| 2026-02-17 | 13F | Millennium Management Llc | 97.516 | 846 | ||||||
| 2026-01-30 | 13F | Us Bancorp \de\ | 83 | 0,00 | 1 | |||||
| 2025-11-14 | 13F | Mount Yale Investment Advisors, LLC | 0 | -100,00 | 0 | -100,00 | ||||
| 2026-01-29 | 13F | IMC-Chicago, LLC | Call | 166.300 | 45,49 | 1.443 | 12,73 | |||
| 2026-02-17 | 13F | ACT Capital Management, LLLP | 10.000 | -71,43 | 87 | -82,94 | ||||
| 2026-01-30 | 13F | Catalytic Wealth RIA, LLC | 24.300 | 21,50 | 211 | -6,25 | ||||
| 2026-02-17 | 13F | Tudor Investment Corp Et Al | 50.299 | -31,59 | 437 | -47,02 | ||||
| 2026-02-10 | 13F | Basepoint Wealth LLC | 100 | 1 | ||||||
| 2026-04-24 | 13F | TSP Capital Management Group, LLC | 8.676 | -8,15 | ||||||
| 2026-02-10 | 13F | Goldman Sachs Group Inc | 188.326 | 50,01 | 1.635 | 16,22 | ||||
| 2025-11-06 | 13F | MQS Management LLC | 0 | -100,00 | 0 | -100,00 | ||||
| 2025-11-13 | 13F | Wells Fargo & Company/mn | Call | 0 | -100,00 | 0 | -100,00 | |||
| 2026-02-13 | 13F | Citigroup Inc | 12.104 | -28,15 | 105 | -44,15 | ||||
| 2026-02-17 | 13F | Bank Of America Corp /de/ | 69.898 | -62,82 | 607 | -71,21 | ||||
| 2026-02-19 | 13F | Invesco Ltd. | 88.856 | 2,75 | 771 | -20,35 | ||||
| 2026-02-17 | 13F | Tower Research Capital LLC (TRC) | 0 | -100,00 | 0 | |||||
| 2026-01-29 | 13F | IMC-Chicago, LLC | 0 | -100,00 | 0 | -100,00 | ||||
| 2026-02-10 | 13F | Quantbot Technologies LP | 35.989 | 312 | ||||||
| 2026-04-24 | 13F | Key FInancial Inc | 42 | 0,00 | 0 | |||||
| 2026-02-12 | 13F | CIBC Private Wealth Group, LLC | 0 | -100,00 | 0 | |||||
| 2026-04-07 | 13F | Signaturefd, Llc | 2.646 | 0,00 | 21 | -9,09 | ||||
| 2026-02-10 | 13F | Envestnet Asset Management Inc | 13.955 | -11,00 | 121 | -30,86 | ||||
| 2026-02-13 | 13F | Verition Fund Management LLC | 49.901 | 433 | ||||||
| 2026-02-17 | 13F | Advisory Services Network, LLC | 0 | -100,00 | 0 | |||||
| 2026-01-23 | 13F | Westside Investment Management, Inc. | 300 | 3 | ||||||
| 2026-02-13 | 13F | State Street Corp | 1.567.080 | 998,43 | 13.602 | 751,72 | ||||
| 2026-02-12 | 13F | Dimensional Fund Advisors Lp | 135.569 | -55,58 | 1.177 | -65,59 | ||||
| 2025-11-12 | 13F | Ameriflex Group, Inc. | 0 | -100,00 | 0 | |||||
| 2026-02-17 | 13F | Two Sigma Advisers, Lp | 0 | -100,00 | 0 | -100,00 | ||||
| 2026-02-11 | 13F | Parallel Advisors, LLC | 325 | 0,00 | 3 | -33,33 | ||||
| 2026-02-12 | 13F | Federation des caisses Desjardins du Quebec | 1.119 | 315,99 | 10 | 200,00 | ||||
| 2026-04-17 | 13F | Values First Advisors, Inc. | 26.920 | 1,02 | 210 | -9,09 | ||||
| 2026-01-21 | 13F | Flagship Harbor Advisors, Llc | 923 | 8 | ||||||
| 2026-04-10 | 13F | Kopion Asset Management, LLC | 926.799 | -0,94 | 7.238 | -10,87 | ||||
| 2026-02-13 | 13F | Sei Investments Co | 17.665 | -17,29 | 153 | -35,98 | ||||
| 2026-03-12 | 13F/A | Peak6 Llc | 4.489 | -91,90 | 39 | -93,87 | ||||
| 2026-03-12 | 13F/A | Peak6 Llc | Put | 8.700 | -85,18 | 76 | -88,58 | |||
| 2026-02-10 | 13F | Rothschild Investment Llc | 10 | 0,00 | 0 | |||||
| 2026-02-12 | 13F | Polen Capital Management Llc | 0 | -100,00 | 0 | |||||
| 2026-02-12 | 13F | Renaissance Technologies Llc | 414.032 | -17,20 | 3.594 | -35,84 | ||||
| 2026-02-13 | 13F | MAI Capital Management | 38 | 0,00 | 0 | |||||
| 2026-02-10 | 13F | Cherry Tree Wealth Management, LLC | 463 | 0,00 | 4 | -20,00 | ||||
| 2026-04-13 | 13F | IFP Advisors, Inc | 1.000 | 0,00 | 8 | -12,50 | ||||
| 2026-02-17 | 13F | Kultura Capital Management LP | Call | 74.900 | 650 | |||||
| 2026-02-05 | 13F | Gabelli Funds Llc | 255.137 | -1,71 | 2.215 | -23,84 | ||||
| 2026-02-09 | 13F | Penn Capital Management Co Inc | 334.760 | 74,74 | 2.906 | 35,43 | ||||
| 2025-11-10 | 13F | Options Solutions, Llc | 0 | -100,00 | 0 | -100,00 | ||||
| 2026-02-12 | 13F | BlackRock, Inc. | 37.915 | -6,71 | 329 | -27,69 | ||||
| 2026-04-09 | 13F | Moody National Bank Trust Division | 71.816 | 561 | ||||||
| 2025-11-13 | 13F | Total Investment Management Inc | 0 | -100,00 | 0 | |||||
| 2026-04-22 | 13F | Motco | 200 | 0,00 | 2 | 0,00 | ||||
| 2026-02-17 | 13F | Cetera Investment Advisers | 0 | -100,00 | 0 | |||||
| 2026-04-08 | 13F | Wealth Enhancement Advisory Services, Llc | 18.419 | 2.669,77 | 4 | -82,35 | ||||
| 2026-02-03 | 13F | Harel Insurance Investments & Financial Services Ltd. | 193.277 | 0,00 | 2 | -50,00 | ||||
| 2026-02-11 | 13F | Simplex Trading, Llc | Call | 146.900 | -27,81 | 1.275 | 63.650,00 | |||
| 2026-02-10 | 13F/A | Northwestern Mutual Wealth Management Co | 2.791 | 87,57 | 24 | 50,00 | ||||
| 2026-02-11 | 13F | Simplex Trading, Llc | Put | 15.900 | 0,00 | 138 | ||||
| 2026-02-11 | 13F | Simplex Trading, Llc | 4.895 | 42 | ||||||
| 2026-04-21 | 13F | Pinnacle Associates Ltd | 633.353 | -4,64 | 4.946 | -14,21 | ||||
| 2026-02-13 | 13F | Hurley Capital, LLC | Call | 50 | 0 | |||||
| 2026-01-27 | 13F | TD Waterhouse Canada Inc. | 2.903 | 25 | ||||||
| 2026-02-13 | 13F | Marshall Wace, Llp | 281.145 | 2.440 | ||||||
| 2025-10-28 | 13F | CarsonAllaria Wealth Management, Ltd. | 0 | -100,00 | 0 | |||||
| 2026-01-16 | 13F | FNY Investment Advisers, LLC | 0 | -100,00 | 0 | |||||
| 2026-02-12 | 13F | Alps Advisors Inc | 99.859 | 867 | ||||||
| 2026-02-13 | 13F | SRS Capital Advisors, Inc. | 55 | 0 | ||||||
| 2025-11-12 | 13F/A | Norges Bank | 0 | -100,00 | 0 | |||||
| 2026-02-13 | 13F | Walleye Trading LLC | Put | 10.100 | 88 | |||||
| 2026-02-13 | 13F | Pathstone Holdings, LLC | 27.906 | -4,90 | 242 | -26,22 | ||||
| 2026-02-17 | 13F | Advisor Group Holdings, Inc. | Call | 10 | 0 | |||||
| 2026-04-13 | 13F | Trust Co | 100 | 1 | ||||||
| 2026-02-12 | 13F | Triumph Capital Management | 0 | -100,00 | 0 | -100,00 | ||||
| 2026-02-06 | 13F | Griffin Asset Management, Inc. | 0 | -100,00 | 0 | -100,00 | ||||
| 2026-02-13 | 13F | Walleye Trading LLC | Call | 9.100 | -30,00 | 79 | -46,21 | |||
| 2026-02-13 | 13F | Walleye Trading LLC | 11.944 | -24,05 | 104 | -41,48 | ||||
| 2025-11-13 | 13F | Css Llc/il | 0 | -100,00 | 0 | |||||
| 2026-01-29 | 13F | IMC-Chicago, LLC | Put | 0 | -100,00 | 0 | -100,00 | |||
| 2025-11-14 | 13F | Raymond James Financial Inc | 0 | -100,00 | 0 | -100,00 | ||||
| 2026-02-17 | 13F | Man Group plc | 22.803 | 198 | ||||||
| 2026-02-02 | 13F | Hussman Strategic Advisors, Inc. | 0 | -100,00 | 0 | -100,00 | ||||
| 2026-02-12 | 13F | Jane Street Group, Llc | 383.173 | 167,19 | 3.326 | 107,04 | ||||
| 2026-02-17 | 13F | Susquehanna International Group, Llp | Call | 585.600 | 32,46 | 5.083 | 2,67 | |||
| 2026-02-12 | 13F | Jane Street Group, Llc | Put | 14.100 | -51,04 | 122 | -62,11 | |||
| 2026-02-11 | 13F | Los Angeles Capital Management Llc | 380 | 4 | ||||||
| 2026-02-12 | 13F | Jane Street Group, Llc | Call | 63.200 | 40,44 | 549 | 8,73 | |||
| 2026-02-11 | 13F | LPL Financial LLC | 127.047 | 56,57 | 1.103 | 21,37 | ||||
| 2026-02-04 | 13F | Pacer Advisors, Inc. | 0 | -100,00 | 0 | |||||
| 2026-04-15 | 13F | Activest Wealth Management | 0 | 0 | ||||||
| 2026-02-09 | 13F | Legal & General Group Plc | 1.032.041 | 11,62 | 8.958 | -13,50 | ||||
| 2026-04-22 | 13F | Formidable Asset Management, LLC | 14.010 | -12,30 | 122 | -32,02 | ||||
| 2026-01-29 | 13F | State Of Michigan Retirement System | 0 | -100,00 | 0 | |||||
| 2026-02-13 | 13F | Formula Growth Ltd | 660.000 | 15,79 | 5.729 | -10,28 | ||||
| 2026-02-17 | 13F | Royal Bank Of Canada | 4.536 | -75,70 | 40 | -80,86 | ||||
| 2026-02-17 | 13F | Susquehanna International Group, Llp | 106.890 | 66,24 | 928 | 28,75 | ||||
| 2026-02-09 | 13F | Royce & Associates Lp | 567.050 | -1,34 | 4.922 | -23,55 | ||||
| 2026-02-17 | 13F | Susquehanna International Group, Llp | Put | 226.400 | 200,66 | 1.965 | 133,10 | |||
| 2026-02-17 | 13F | Invenomic Capital Management LP | 2.127.610 | -0,30 | 18.468 | -22,74 | ||||
| 2026-02-13 | 13F | Van Eck Associates Corp | 19.475 | 8,89 | 0 | |||||
| 2026-04-15 | 13F | Exchange Traded Concepts, Llc | 1.835.681 | 12,66 | 14.337 | 1,36 | ||||
| 2026-02-12 | 13F | Nuveen, LLC | 418.001 | -0,68 | 3.628 | -23,02 | ||||
| 2026-02-13 | 13F | Centiva Capital, LP | 0 | -100,00 | 0 | |||||
| 2026-02-05 | 13F | Gamco Investors, Inc. Et Al | 182.067 | -0,55 | 1.580 | -22,93 | ||||
| 2026-04-07 | 13F | Farther Finance Advisors, LLC | 439 | 4.290,00 | 3 | |||||
| 2026-01-29 | 13F | UBS Group AG | 632.518 | 87,35 | 5.490 | 45,20 | ||||
| 2026-02-10 | 13F | Bnp Paribas Arbitrage, Sa | 8 | 0,00 | 0 | |||||
| 2026-02-05 | 13F | Teton Advisors, LLC | 10.000 | 0,00 | 87 | -23,21 | ||||
| 2026-02-13 | 13F | Rhumbline Advisers | 2.620 | 0,00 | 23 | -24,14 | ||||
| 2026-02-13 | 13F | Toroso Investments, LLC | 53.084 | -5,72 | 461 | -26,98 | ||||
| 2026-02-17 | 13F | Russell Investments Group, Ltd. | 0 | -100,00 | 0 | |||||
| 2025-11-14 | 13F | Squarepoint Ops LLC | 0 | -100,00 | 0 | -100,00 | ||||
| 2026-02-05 | 13F | Bank Julius Baer & Co. Ltd, Zurich | 190 | -23,08 | 2 | -75,00 | ||||
| 2025-11-13 | 13F | Magnetar Financial LLC | 0 | -100,00 | 0 | |||||
| 2026-02-17 | 13F | VARCOV Co. | 52.649 | 457 | ||||||
| 2026-02-11 | 13F | Jpmorgan Chase & Co | 198 | 0,00 | 2 | -50,00 | ||||
| 2026-02-12 | 13F | Steward Partners Investment Advisory, Llc | 3 | 0 | ||||||
| 2026-04-16 | 13F | Toth Financial Advisory Corp | 800 | 0,00 | 6 | 0,00 | ||||
| 2026-02-11 | 13F | Jpmorgan Chase & Co | Call | 33.300 | -0,30 | 289 | -22,73 | |||
| 2026-02-13 | 13F | Walleye Capital LLC | Call | 4.800 | -80,33 | 42 | -84,98 | |||
| 2026-02-13 | 13F | Walleye Capital LLC | Put | 9.200 | 196,77 | 80 | 132,35 | |||
| 2025-11-14 | 13F | Peak6 Llc | Call | 0 | -100,00 | 0 | -100,00 | |||
| 2026-02-13 | 13F | Walleye Capital LLC | 1 | 0 |